Model-Driven Reports. Deployed Systems. Institutional Results.
Trade with logic. Scale with precision.
We specialize in delivering research-grade quantitative trading reports and deployable infrastructure for alpha strategy validation, systematic execution, and data engineering at scale.
Strategy Design & Backtesting Frameworks
From idea to code. From backtest to decision.
Data Engineering & Predictive Modeling
Bridge the gap between raw data and market edge.
Model Deployment, Automation & MLOps
From research notebooks to production-grade systems.
Signal Generation Engine
The RABITAI engine processes raw price action into actionable trades using a strict, transparent pipeline. Every component is deterministic, auditable, and built to mirror institutional-grade systems.
Ingest
Live multi-venue market data ingestion.
The pipeline begins by synchronizing live feeds across sources such as TradingView, Capital.com, and fallback OHLCV aggregators. This ensures consistent, low-latency input data for signal computation.
  def get_ta(tv_sym: str, exchange: str, screener: str, interval):
      # ...Try TradingView_TA first. If that returns no indicators,
    switch to the local indicator engine (via Yahoo) and return
    a drop-in dummy TA object....
      try:
        data = TA_Handler(symbol=tv_sym,
                          exchange=exchange,
                          screener=screener,
                          interval=interval).get_analysis()
      # ...try......
Feature Extraction
Building a technical fingerprint for every opportunity.
Once raw data is collected, the engine computes both conventional and exotic technical indicators to describe market structure, trend strength, volatility, and sentiment.
  def local_indicators(df: pd.DataFrame) -> dict:
      # ...ensure series.....
           close = df["Close"].squeeze()  # ensure 1D series
    high  = df["High"].squeeze()
    low   = df["Low"].squeeze()

    # Moving averages
    ema9   = _ema(close, 9).iloc[-1].item()
    ema21  = _ema(close, 21).iloc[-1].item()
    ...
Edge Scoring
Quantifying the signal’s statistical validity
This stage transforms the extracted features into a single score using a logistic regression model augmented with domain-specific logic.
  def calculate_trade_probability(
      # ... Estimate trade success probability (0–100) via a logistic on normalized features......
      adx_raw = indicators.get("ADX", 0.0)
    adx = np.clip(adx_raw / 50.0, 0.0, 1.0)

    weights = weights or {}
    for feature in ["adx", "ema_macd", "ao", "cci", "rsi", "tf", "entropy"]:
        if feature not in weights:
            weights[feature] = 0.0
    ) ...
Order Submission
Trade execution-ready payload generation
Once a signal passes the edge gate, it’s formatted into a broker-compatible trade structure and sent via RESTful API.
  def execute_trade(
        symbol: str,
        epic: str,
        direction: str,              # "BUY" | "SELL"
        size: float,                 # contracts (NOT USD)
        entry: float,                # activation level for the working order
        stop_level: float,
        profit_level: float,...
  raw market feeds  ─┐
  TA indicators (TV) ─┼─►  analyze_ticker()                           ←── dynamic RF weights (optional retrain)
  OHLCV history      ─┘          │
                                 ├─► confidence builder  ─┐
                                 │                       ├─► size / risk layer (not covered here)
  GPT-4 meta-signal  ◄───────────┘
                                 │
                                 └─► calculate_trade_probability() ─► P( success )
                                                                       (0–100)
Our Approach
A quick‑reference for traders—how the engine decides what to trade and when. These rules, in combination, help the system decide whether the current market data supports entering a trade, while also managing risk and avoiding duplicate orders.
⤷ Data Integrity
Live price & OHLCV required; skip zero‑volume or missing‑candle symbols.
Must have valid real‑time price, OHLCV data, and a successfully resolved EPIC.
Skip if no valid volume or if OHLCV is missing.
⤷ Position Hygiene
Ignore symbols with an open position or working order.
Do not consider a trade if an open position already exists for the same EPIC.
Also, skip if a working order is already in place..
⤷ Asset‑Class Filters
Session, RSI, volume & ADX thresholds vary by forex, equities, commodities, crypto.
Apply asset-specific filters to ensure trades are only considered during appropriate market conditions.
For example, forex trades may require different RSI or volume thresholds than equities.
⤷ Technical Gates
RSI in range, ATR/price ratio adjust, breakout bonus, entropy bias.
Apply technical gates to filter out trades that do not meet minimum criteria.
For example, RSI must be within a certain range, ATR/price ratio must be above a threshold, and entropy must indicate sufficient predictability.
⤷ Mean-Reversion Override
Extreme RSI & Bollinger touch caps or lifts confidence.
If RSI is extremely high or low, apply a mean-reversion override to adjust confidence.
For example, if RSI is above 70 or below 30, increase confidence for a potential reversal.
⤷ Momentum Gate
ADX + MACD Δ + AO must produce a score ≥ 0.25.
Momentum gate requires a minimum score based on ADX, MACD, and AO indicators.
For example, if the combined score is below 0.25, skip the trade.
⤷ Multi-TF Vote
Net vote across 15 m – 1 d frames adds × 0.19 to confidence and sets direction.
Aggregate votes across multiple timeframes (15m, 30m, 1h, 4h) to determine overall direction.
For example, if the majority of timeframes vote BUY, add a confidence boost and set direction to BUY.
⤷ Client Sentiment
Crowd long/short percentages → bias scaled ±0.15.
Incorporate client sentiment data to adjust confidence.
If the majority of clients are long, add a positive bias; if short, add a negative bias.
⤷ Probability Check
Logistic model on tech factors; hard-reject if probability < 30 %.
Use a logistic regression model to calculate the probability of success based on technical factors.
If the probability is below 30%, hard-reject the trade.
⤷ Supply/Demand Zones
If price near a volume-profile zone, add momentum-scaled bonus.
Check if the current price is near a significant supply or demand zone based on volume profile.
If so, add a momentum-scaled bonus to confidence.
⤷ Asset‑Class Filters
Session, RSI, volume & ADX thresholds vary by forex, equities, commodities, crypto.
Apply asset-specific filters to ensure trades are only considered during appropriate market conditions.
For example, forex trades may require different RSI or volume thresholds than equities.
⤷ Execution Threshold
Trade only when both confidence & probability clear asset-specific bars.
Final execution requires both confidence and probability to exceed asset-specific thresholds.
For example, forex trades may require a minimum confidence of 0.5 and probability of 0.3, while equities may have different thresholds.
Precision Trades.
Real Results. Delivered Daily.
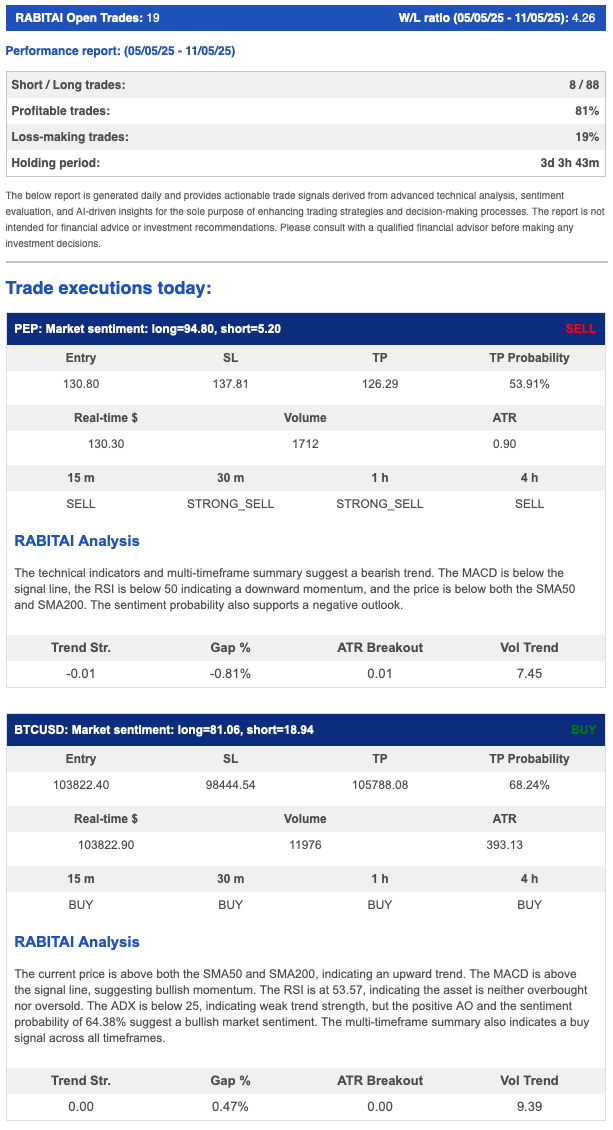
We don’t just issue trading signals—we publish verifiable results with full transparency. Every trade idea we deliver includes real-time entries, take-profit probabilities, and a breakdown of multi-factor confirmation—so traders understand not just what to trade, but why.
What’s Inside Your Daily Trade Report
Every RABITAI report you receive is more than just a trade idea—it’s a fully automated, precision-engineered breakdown of market conditions, technical confluence, and probability-weighted opportunities.
- Real-time Entry, SL, TP, and TP Probability
- Multi-timeframe Signal Alignment (15m, 30m, 1h, 4h)
- Clear BUY/SELL classification per timeframe
- Live volume, ATR, volatility pressure, and risk structure
- Full AI-written rationale explaining market context
Engineered by Indicators That Matter
The underlying analysis is driven by our institutional-grade, multi-model framework, combining:
- ADX-weighted momentum scoring – to measure directional strength and conviction
- ATR volatility-normalized breakouts – identifying explosive moves with context
- Logistic regression TP forecasting – delivering a numeric TP hit probability
- Entropy + RSI cross-analysis – detecting market indecision or regime shift
- Volume profile & SMA crossovers – confirming structure and bias
- Multi-timeframe consensus – aligning all timeframes to reduce signal noise
See the Signal, Spot the Setup
Your daily RABITAI email isn’t just a list of tickers—it’s a side-by-side narrative that lines up every call with what you’re actually seeing on the TradingView chart.
- Instant visual validation of the written rationale
- Data-rich e-mail cards → live chart markers
- Risk-to-reward you can trust
NEWS
We pull in the top headlines for your tracked tickers and fold them directly into our signal engine.
These real-time headlines feed both our sentiment-bias calculator and the LLM “second opinion,” alerting you to breaking developments that might derail technical setups, skew market psychology or require an immediate risk adjustment.
In short, NEWS isn’t just decoration: it provides the qualitative context that ensures our edge model blends pure price-action with the narrative catalysts driving today’s volatility.
CODE
RABITAI delivers institutional-grade trading signals by fusing real-time multi-venue data, machine learning, and logistic regression. Each trade includes risk-managed entry, SL, and TP levels, validated by multi-timeframe consensus and adaptive indicator weighting. Every signal is paired with GPT-4-generated rationale and real-time performance tracking—giving you not just what to trade, but the quantified “why.”
Analyse ticker
Extracts features, computes confidence, and generates the core signal for each ticker.
  def analyze_ticker(symbol):
      # ...fetch price, volume, indicators...
      tech_conf = weighted_score(indicators)
      probability = calculate_trade_probability(indicators)
      # ...LLM rationale, entry/SL/TP, etc...
      return tech_conf, probability, llm_signal, llm_reason, ...
Calculate trade probability
Turns indicator values into a probability using a logistic regression model.
  def calculate_trade_probability(indicators):
      score = (
          indicators['ADX'] * 0.2 +
          indicators['RSI'] * 0.15 +
          indicators['MACD'] * 0.25 +
          indicators['ATR'] * 0.1 +
          indicators['Volume'] * 0.3
      )
      return 1 / (1 + np.exp(-score))  # Sigmoid
Generate LLM rationale
Takes the symbol, indicators, and model decision (BUY/SELL) into account.
  def generate_llm_rationale(symbol, indicators, decision):
      prompt = (
          f"Given the following indicators for {symbol}: {indicators}, "
          f"explain in plain English why the model recommends {decision}."
      )
      response = openai.ChatCompletion.create(
          model="gpt-4",
          messages=[{"role": "user", "content": prompt}]
      )
      return response['choices'][0]['message']['content']
ASSET TUNING LOGIC
| Asset-class | Typical volatility (ATR / price) |
Volume data? | Neutral RSI band | “Break-out” threshold | Entropy baseline* |
|---|---|---|---|---|---|
| Equities / ETFs | ≈ 2 % | exchange-reported | 40 – 65 | > 1.5 × ATR | 1.9 |
| Indices / Benchmarks | ≈ 1 % | composite / high | 45 – 60 | > 1.25 × ATR | 1.6 |
| Forex | ≈ 0.5 % | none / unreliable | 45 – 55 | > 2.0 × ATR | 1.4 |
| Commodities | ≈ 1.5 % | futures volume | 35 – 65 | > 1.75 × ATR | 1.7 |
| Crypto | ≈ 5 % | on-chain + exch. | 35 – 70 | > 2.0 × ATR | 2.3 |
| Asset Class | Tickers |
|---|---|
| Equities / ETFs | AAPL, AMZN, MSFT, GOOG, NVDA, TSLA, CRM, NFLX, AVGO, AMD, ORCL, UBER, COST, CROX, QRVO, HON, EA, SNOW, ADBE, QQQ, SQQQ, SPY, MRNA, BIDU, ASML, AZN, BBIO, CHEF, MDLZ, SNY, PEP, SHOP, INTC, CSCO, QCOM, LYFT, PODD, TMDX, RUM, ONTO, GMED, COMP, AFRM, GSAT, RGC |
| Indices & Benchmarks | VIX, DXY, QQQ, SPY, SQQQ |
| Cryptos | BTCUSD, ETHUSD |
| FX | EURUSD, GBPUSD, USDJPY, USDCHF, AUDUSD, USDCAD, NZDUSD, EURJPY, GBPJPY, EURGBP |
| Commodities | Gold, Silver, Platinum, Palladium, GLD, SLV, UGL |
R A B I T A I
INTRA DAY / SWING REPORT
|
✅ Weekly curated trade reports Clear entry, stop-loss, take-profit, and probability metrics on top-performing setups. |
✅ Full strategy context Includes technical rationale, trend strength, sentiment direction, and timeframe alignment. |
|
✅ Delivered via E-mail & Discord Get your report every week at optimal market sessions. |
✅ No noise, no distractions No ads, no affiliate schemes. Just a clean feed for serious algorithmic and swing traders. |
|
✅ Exclusive access to developer tools Join optional code walkthroughs, strategy breakdowns, and debugging sessions for quant coders. |
✅ Transparent performance metrics We track and share win rate, R:R ratios, and SL/TP outcomes openly—no cherry-picking. |
By submitting this form, you consent to our Terms of Service and Privacy Policy.
Frequently Asked Questions
How does RABITAI generate its trading signals?
RABITAI combines multi-timeframe technical analysis, machine learning, and real-time data to generate trade signals. It analyzes indicators like EMA, MACD, RSI, ADX, ATR, and volume across several timeframes, then uses logistic regression and dynamic weighting to estimate trade probabilities. Each signal is further validated by an AI model (GPT-4) for rationale and robustness.
What makes the probability and confidence scores reliable?
Probability and confidence scores are calculated using a blend of normalized technical indicators, machine learning–derived weights, and market regime filters. The system dynamically adjusts these weights based on historical performance, and incorporates volatility, sentiment, and multi-timeframe consensus to ensure robust, adaptive scoring..
How are entry, stop-loss, and take-profit levels determined?
Entry, SL, and TP levels are calculated using a combination of ATR-based volatility, recent price action, and technical regime detection. The system adapts these levels dynamically to current market conditions, ensuring optimal risk/reward and compliance with broker constraints.
How does the reporting and email system work?
After each daily scan, RABITAI generates a detailed HTML report that includes all actionable signals, performance metrics, and news sentiment. This report is emailed to users and includes trade charts, multi-timeframe votes, and AI-generated rationales for each trade. The same signals are also posted to Discord and Twitter for real-time alerts.
How does the system use AI for explainability?
For every trade signal, RABITAI uses GPT-4 to generate a plain-English rationale that explains the technical and statistical reasoning behind the recommendation. This ensures transparency and helps users understand the “why” behind each trade.
How does RABITAI adapt to changing market conditions?
The system continuously logs trade outcomes and indicator data, retraining its machine learning models to refine indicator weights and improve future signal accuracy. It also adjusts thresholds and risk controls based on detected market regimes, volatility, and sentiment trends.